[et_pb_section admin_label=”section”][et_pb_row admin_label=”row”][et_pb_column type=”4_4″][et_pb_text admin_label=”Text” background_layout=”light” text_orientation=”left” use_border_color=”off” border_color=”#ffffff” border_style=”solid”]
Sketches and Research:
For this project I decided to something that I have never done before, so I decided that I wanted to create an info-graphic. Which I have come to find out is a little bit more difficult then I originally thought. But first I had to pick an idea, I wanted to do something that I was passionate about. So I decided to write down somethings that I really enjoy, some of the ideas were video games, Sasquatch, sound design, and Halo the video game. But after a while I decided that I was pretty passionate about Sasquatch. So after narrowing the themes down, I decided to do an info-graphic about sightings in the United States.
So next came the sketching:
[/et_pb_text][/et_pb_column][/et_pb_row][et_pb_row admin_label=”Row”][et_pb_column type=”1_2″][et_pb_image admin_label=”Image” src=”http://www.clintaverett.com/wp-content/uploads/2016/10/sk2-1.jpg” show_in_lightbox=”off” url_new_window=”off” use_overlay=”off” animation=”off” sticky=”off” align=”left” force_fullwidth=”off” always_center_on_mobile=”on” use_border_color=”off” border_color=”#ffffff” border_style=”solid”] [/et_pb_image][/et_pb_column][et_pb_column type=”1_2″][et_pb_image admin_label=”Image” src=”http://www.clintaverett.com/wp-content/uploads/2016/10/sk1-1.jpg” show_in_lightbox=”off” url_new_window=”off” use_overlay=”off” animation=”off” sticky=”off” align=”left” force_fullwidth=”off” always_center_on_mobile=”on” use_border_color=”off” border_color=”#ffffff” border_style=”solid”] [/et_pb_image][/et_pb_column][/et_pb_row][et_pb_row admin_label=”Row”][et_pb_column type=”4_4″][et_pb_text admin_label=”Text” background_layout=”light” text_orientation=”left” use_border_color=”off” border_color=”#ffffff” border_style=”solid”]
And some of my outlines of how I wanted the infographic to be laid out:
[/et_pb_text][/et_pb_column][/et_pb_row][et_pb_row admin_label=”Row”][et_pb_column type=”1_2″][et_pb_image admin_label=”Image” src=”http://www.clintaverett.com/wp-content/uploads/2016/10/sk4-1.jpg” show_in_lightbox=”off” url_new_window=”off” use_overlay=”off” animation=”off” sticky=”off” align=”left” force_fullwidth=”off” always_center_on_mobile=”on” use_border_color=”off” border_color=”#ffffff” border_style=”solid”] [/et_pb_image][/et_pb_column][et_pb_column type=”1_2″][et_pb_image admin_label=”Image” src=”http://www.clintaverett.com/wp-content/uploads/2016/10/sk3-1.jpg” show_in_lightbox=”off” url_new_window=”off” use_overlay=”off” animation=”off” sticky=”off” align=”left” force_fullwidth=”off” always_center_on_mobile=”on” use_border_color=”off” border_color=”#ffffff” border_style=”solid”] [/et_pb_image][/et_pb_column][/et_pb_row][et_pb_row admin_label=”Row”][et_pb_column type=”4_4″][et_pb_text admin_label=”Text” background_layout=”light” text_orientation=”left” use_border_color=”off” border_color=”#ffffff” border_style=”solid”]
Now I know that my drawing leaves a lot to be desired, but these are some of the ideas that I was playing with. And after doing research on the numbers of sightings using bfro.net, they are group that does research on Sasquatch, I spend around 6 hours looking through there information, and compiling it and deciding what I wanted on the infographic.
Rough draft:
So next came a mockup of the design, this was really hard for me, I wanted to see what it would look like so I only designed one of the sections. I went with sightings according to the seasons.
[/et_pb_text][et_pb_image admin_label=”Image” src=”http://www.clintaverett.com/wp-content/uploads/2016/10/sasquatch-post.jpg” show_in_lightbox=”off” url_new_window=”off” use_overlay=”off” animation=”off” sticky=”off” align=”left” force_fullwidth=”off” always_center_on_mobile=”on” use_border_color=”off” border_color=”#ffffff” border_style=”solid”] [/et_pb_image][et_pb_text admin_label=”Text” background_layout=”light” text_orientation=”left” use_border_color=”off” border_color=”#ffffff” border_style=”solid”]
After designing it I hated it, ha-ha. I thought it was to basic and to boring, it really did not catch the eye at all. In fact, the only thing I liked from this was the vector of Sasquatch that I made. But I was hitting a blank about how to spice it up. Finally, after talking to a few people, and looking at a ton of info-graphics online it was back to Illustrator to make a new design. I liked the idea of making a vector drawing of the United states and make a graph out of that. So this was the other new rough draft, but I decided to do the section of Sightings according the state.
[/et_pb_text][et_pb_image admin_label=”Image” src=”http://www.clintaverett.com/wp-content/uploads/2016/10/Screen-Shot-2016-10-05-at-5.06.13-PM.png” show_in_lightbox=”off” url_new_window=”off” use_overlay=”off” animation=”off” sticky=”off” align=”left” force_fullwidth=”off” always_center_on_mobile=”on” use_border_color=”off” border_color=”#ffffff” border_style=”solid”] [/et_pb_image][et_pb_text admin_label=”Text” background_layout=”light” text_orientation=”left” use_border_color=”off” border_color=”#ffffff” border_style=”solid”]
I also decided to use an image of a forest for the background, because that is the most common word people gave me what I asked them to come up with one word that they associate with Sasquatch. And the color I used for the graph came by sort of by accident. I was trying to use the eye drop tool to get the brown of the Sasquatch but I clicked on a part of the picture and it came up with that color, I thought it fit pretty well, and decided to use it. The map of the United States proved to be more difficult than I thought. It took me about 3 hours to design.
Final draft:
After I designed It, I made the graph, using the numbers that I had previously researched. And after getting more feedback I decided to change how the title looks, some of the positioning of the data. Then I put everything together, and made this.
[/et_pb_text][et_pb_image admin_label=”Image” src=”http://www.clintaverett.com/wp-content/uploads/2016/10/Sasquatch-Info-Graphic.jpg” show_in_lightbox=”off” url_new_window=”off” use_overlay=”off” animation=”off” sticky=”off” align=”left” force_fullwidth=”off” always_center_on_mobile=”on” use_border_color=”off” border_color=”#ffffff” border_style=”solid”] [/et_pb_image][et_pb_text admin_label=”Text” background_layout=”light” text_orientation=”left” use_border_color=”off” border_color=”#ffffff” border_style=”solid”]
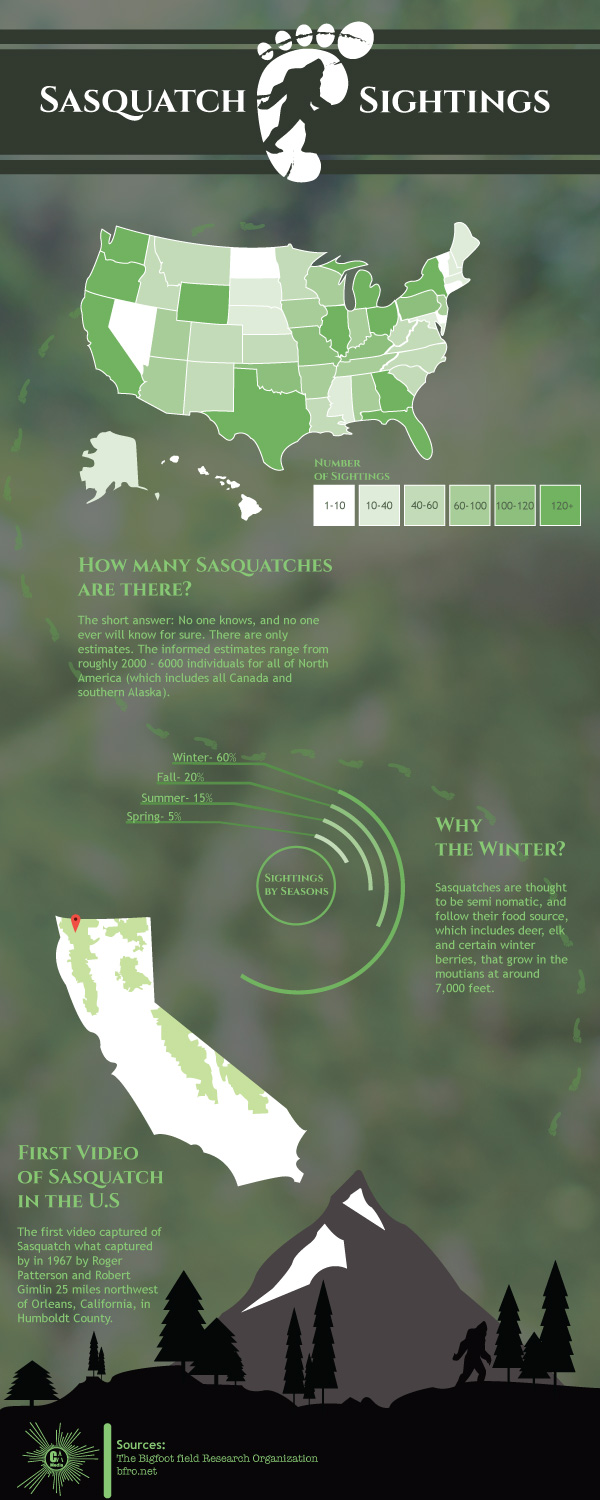
But After many, and I mean a lot, of critiquing, the above infographic looked, more or less childish. So I re-did pretty much everything on the info graphic. I kept the map and graph, but I changed the color, the various colors of green found in the background, white, and black. This is my final color scheme.
[/et_pb_text][et_pb_image admin_label=”Image” src=”http://www.clintaverett.com/wp-content/uploads/2016/10/Vectors-for-blog-post-color.jpg” show_in_lightbox=”off” url_new_window=”off” use_overlay=”off” animation=”off” sticky=”off” align=”left” force_fullwidth=”off” always_center_on_mobile=”on” use_border_color=”off” border_color=”#ffffff” border_style=”solid”] [/et_pb_image][et_pb_text admin_label=”Text” background_layout=”light” text_orientation=”left” use_border_color=”off” border_color=”#ffffff” border_style=”solid”]
I change the bottom mountains, and the title. Basically I tore the whole infographic down to the bones, and then gave it a new body. Here are some of the new vectors I created.
[/et_pb_text][/et_pb_column][/et_pb_row][et_pb_row admin_label=”Row”][et_pb_column type=”1_2″][et_pb_image admin_label=”Image” src=”http://www.clintaverett.com/wp-content/uploads/2016/10/Vectors-for-blog-post-sas.jpg” show_in_lightbox=”off” url_new_window=”off” use_overlay=”off” animation=”off” sticky=”off” align=”left” force_fullwidth=”off” always_center_on_mobile=”on” use_border_color=”off” border_color=”#ffffff” border_style=”solid”] [/et_pb_image][et_pb_image admin_label=”Image” src=”http://www.clintaverett.com/wp-content/uploads/2016/10/Vectors-for-blog-post-tree.jpg” show_in_lightbox=”off” url_new_window=”off” use_overlay=”off” animation=”off” sticky=”off” align=”left” force_fullwidth=”off” always_center_on_mobile=”on” use_border_color=”off” border_color=”#ffffff” border_style=”solid”] [/et_pb_image][et_pb_image admin_label=”Image” src=”http://www.clintaverett.com/wp-content/uploads/2016/10/Vectors-for-blog-post-moutains.jpg” show_in_lightbox=”off” url_new_window=”off” use_overlay=”off” animation=”off” sticky=”off” align=”left” force_fullwidth=”off” always_center_on_mobile=”on” use_border_color=”off” border_color=”#ffffff” border_style=”solid”] [/et_pb_image][/et_pb_column][et_pb_column type=”1_2″][et_pb_image admin_label=”Image” src=”http://www.clintaverett.com/wp-content/uploads/2016/10/Vectors-for-blog-post-foot-print.jpg” show_in_lightbox=”off” url_new_window=”off” use_overlay=”off” animation=”off” sticky=”off” align=”left” force_fullwidth=”off” always_center_on_mobile=”on” use_border_color=”off” border_color=”#ffffff” border_style=”solid”] [/et_pb_image][et_pb_image admin_label=”Image” src=”http://www.clintaverett.com/wp-content/uploads/2016/10/Vectors-for-blog-post-foot.jpg” show_in_lightbox=”off” url_new_window=”off” use_overlay=”off” animation=”off” sticky=”off” align=”left” force_fullwidth=”off” always_center_on_mobile=”on” use_border_color=”off” border_color=”#ffffff” border_style=”solid”] [/et_pb_image][et_pb_image admin_label=”Image” src=”http://www.clintaverett.com/wp-content/uploads/2016/10/Vectors-for-blog-post-us.jpg” show_in_lightbox=”off” url_new_window=”off” use_overlay=”off” animation=”off” sticky=”off” align=”left” force_fullwidth=”off” always_center_on_mobile=”on” use_border_color=”off” border_color=”#ffffff” border_style=”solid”] [/et_pb_image][/et_pb_column][/et_pb_row][et_pb_row admin_label=”Row”][et_pb_column type=”4_4″][et_pb_text admin_label=”Text” background_layout=”light” text_orientation=”left” use_border_color=”off” border_color=”#ffffff” border_style=”solid”]
The State of California was just copied from my map of the U.S., And the National Forests on there where created by looked at google maps and outlining it. The foot print was created by looking at 4 different vector footprints that I found online, and then made my own, I like the idea that one of the foot prints had by putting some of the creases that a foot has. And then I took that with my Sasquatch Vector, and cut that out of the foot to make the vector you see in the title. Mountain was created also by looking at about 4 different vector mountain ranges and then trying to replicate them into my own, idea. The Sasquatch was made by the same process. The tree wasn’t too hard, I made and triangle and then used the transformation tool in Illustrator, and combined them all with the shape building tool. The map of the united states was made by tracing a map of the U.S.
[/et_pb_text][et_pb_image admin_label=”Image” src=”http://www.clintaverett.com/wp-content/uploads/2016/10/O-Sasquatch-info.jpg” show_in_lightbox=”on” url_new_window=”off” use_overlay=”off” animation=”off” sticky=”off” align=”left” force_fullwidth=”off” always_center_on_mobile=”on” use_border_color=”off” border_color=”#ffffff” border_style=”solid”] [/et_pb_image][et_pb_text admin_label=”Text” background_layout=”light” text_orientation=”left” use_border_color=”off” border_color=”#ffffff” border_style=”solid”]
It turned out pretty well, and I think it is pretty easy to understand. Overall I really enjoyed the project, I spent many hours trying to design all of this. But I built on some skills that I will be able to use in the future.
[/et_pb_text][/et_pb_column][/et_pb_row][/et_pb_section]